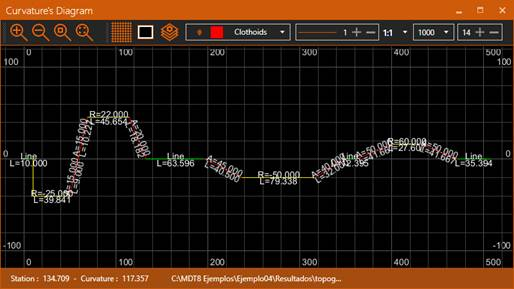
If we open a horizontal alignment file (EJE) a floating window will appear displaying, it’s curvature’s diagram.
At the top we have a toolbar with controls identical to the ones in the main window’s toolbar. Except for the two last controls to the right:
From left to right:
·Curvature’s factor: Factor to use when displaying the curvature’s diagram where the curvature is calculated as: Radius / Curvature’s factor.
·Text height: Size of the curvature’s diagram’s texts.
On the drawing each horizontal alignment segment in displayed in a different color: green for lines, red for clothoids and yellow for curves. The texts that are displayed for each segment type are:
·Lines: Line and the segment’s length.
·Curve: Radius and segment’s length
·Clothoid: Parameter (A) and segment’s length
At the window’s bottom, there’s a status bar displaying the cursor’s coordinates (as Station and Curvature) and the active horizontal alignment’s file.