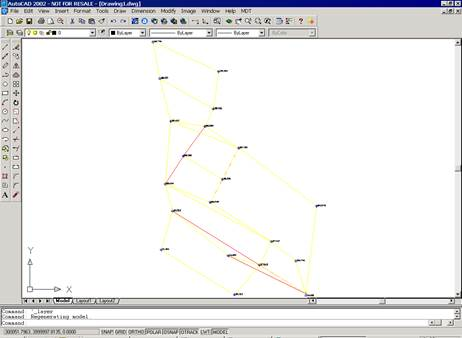
This utility is accessed through the Surveying > Drawing > Draw Station Observations drop down-menu option or by clicking the Draw Stations button in the Station Calculation dialog box. The station and line graphics representing observations between them are drawn. One or two arrows will be drawn at the ends of these lines. These arrows show the direction of the observations, i.e. whether they are forward or backward observations.
Line colour represents the type of observation, which can be red for complete forward observations, yellow for complete backward observations and blue for angle observations. In latter case, a broken or dashed line is displayed.
The information on any of these lines can be edited using the Surveying > Utilities > Information command. Consult the relevant section for further details..