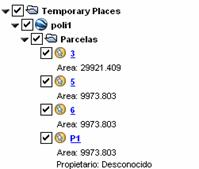
The elements created with the commands Utilities > Plots are exported individually. Each one of these is individually listed on the left-hand panel of Google Earth, in the folder Plot, including associated details on the Area, and whether an Owner or Reference exist.
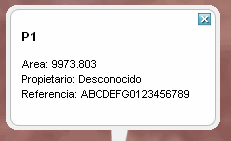
In exactly same way as for points, clicking on the name of the plot a floating window is displayed with its details.
In regard to the graphic representation, the plots are shown as a closed polyline and colored, similar to the way that surfaces are visualized.