17.21. Draw Mass Diagram |
Next it will optionally request a file to save any type of earthworks that we have been able to make in the road and finally the following dialog box will appear for configuring the characteristics of the different diagrams to be drawn.
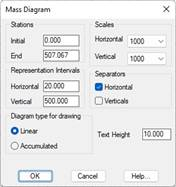
Initial Station: Initial station where the analysis begins.
Final Station: Final station where the analysis ends.
Vertical Scale: Vertical scale of the drawing, which affects both the diagram and the text labelling.
Horizontal Scale: Horizontal scale of the drawing, which affects both the diagram and the text labelling.
Horizontal Representation Interval: Spacing of the stations on the horizontal alignment in the representation.
Vertical Representation Interval: Spacing of the volume markings on the vertical alignment in the representation.
Text Height: Height of the texts labelled
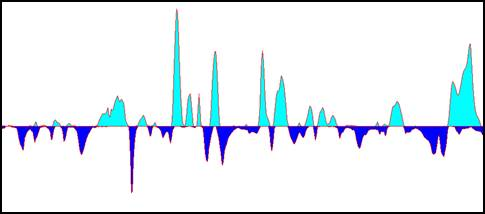
Mass Diagram Accumulated at Origin
This diagram shows areas with a predominance of cut or fill. Positive slopes indicate a predominance of cut and the negative ones fill.
A flatter diagram indicates greater compensation between cut and fill. Below is a screenshot of this type of diagram.
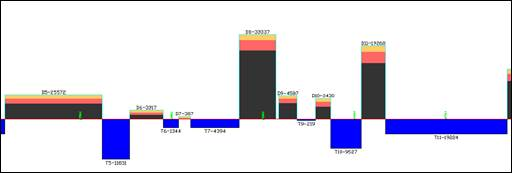
Rectangle graphs of cut and fill
This diagram is used to represent the different cut and fill compensations of the terrain.
The cut appears broken down in different areas, depending on the different geological types.
· Soil is represented in yellow.
· Shale is represented in magenta.
· Rock is represented in brown.
When the dialog box is validated, the program will save the data processed in the corresponding mass diagram file.
This file is important because in successive applications of the command with the same segment, selecting it considerably speeds up the process, and saves important information on the earthworks that have been carried out.
|
|