18.4. Draw Elevation Map
This command shows a grid file and assigns different colors, according to the cell heights.
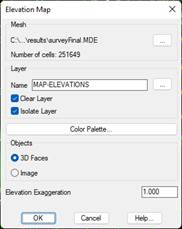
Layer: Name of the layer on which the elevation map will be drawn.
The Color Palette button shows the following dialogue which shows the elevation ranges, the color assigned and the different palettes available for assignment. The default configuration for intervals and the color palette may be edited in Map Configuration.
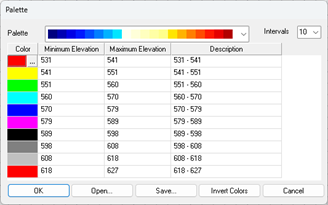
On the list we will be able to see the different colors assigned to each of the elevation ranges. In addition to each interval, there is an associated description which the user may customize.
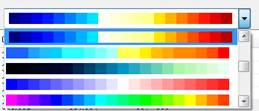
Palette: Color Palette to be assigned. Some of the palettes available can be seen below:
Intervals: Color interval to be created, as many colors can be created as are available on the palette.
Invert Colors: Inverts the color settings set in the current palette.
Edit: Editing of a given interval with the possibility of changing the minimum and maximum values and the description thereof.
Delete: Possibility of deleting one of the intervals.
Both when editing and deleting any interval, the rest of the intervals will be recalculated in line with the minimum and maximum values specified.
Save: Possibility of saving in a file the whole configuration of intervals, colors, description… in such a way that it can be recovered at any time.
Load: By using this option, we will recover a configuration that has been previously saved with the previous option.
3D Faces: The elevation map is drawn with CAD 3DFACE entities.
· 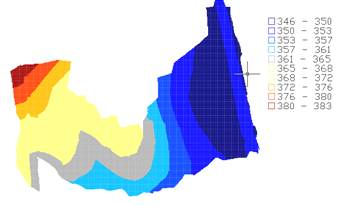
Image: The height map is recorded as an image. With the Transparency option, a transparency factor is set to the created image. The created image will be TIF formatted and will have the name of the mesh file with the suffix "elevation".
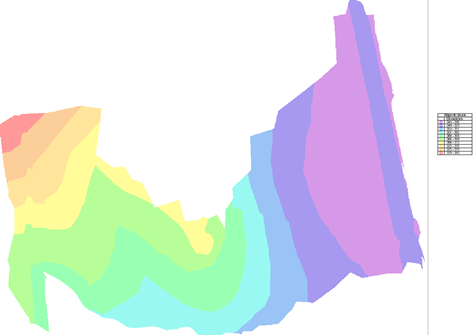
Image with 40% transparency
|
|