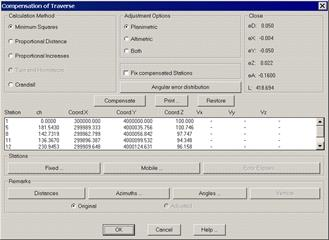
Once the Adjust button is clicked, a dialog box appears displaying each station’s current coordinates and a series of controls that allow one to consult the data that will be used in the calculation, as well as to set the method one wishes to use.
In order to be able to adjust a traverse, it is necessary that all the stations (fixed and mobile) have previously assigned coordinates and that these are correctly orientated, using either the Automatic Calculation or Manual Calculation commands. There must also be an observation sequence, so that there is at least one observation from the i to the i+1 stations.
Firstly, one has to decide on the method. One can also choose whether a Planimetric adjustment (just X and Y), a Height adjustment (just Z) adjustment or Both (X,Y,Z) are desired.
There must be at least one fixed station to perform the adjustment after having activated the Fix Origin or Fix Destination check boxes in the previous screen. It is possible to consult which are fixed and which are mobile, by clicking the Fixed and Mobile buttons respectively. The Fix Adjusted Stations check box fixes each of the mobile stations after doing the calculation.
The Distances, Azimuths, Angles and Verticals buttons allow one to examine the data to be used in the calculation from the information contained the station observations making up the traverse. They basically contain the origin and observed stations, the observed value, the calculated value and the standard deviation. The latter element is determined from the configuration, especially regarding the accuracy of the equipment and its observations. Consult the Customization Manual for further details.
Except in angle observations, all observations can be edited by double clicking on the appropriate element in the list or by selecting the element and clicking the Edit button. The corresponding observation’s data is then displayed for editing. If the Delete button in the observation list is clicked, the field is deleted from the station observations database. Observation lists can also be obtained by clicking the Print button in each list.
If the Traverse has just been adjusted, the Adjusted check box is enabled, so that one may select the adjusted or original observations as desired on the basis of the box marked. All this information can also be printed in a report (see further below).
The program performs the adjustment process when the Adjust button is clicked. It then displays the differences between the original and adjusted coordinates on screen. Fixed stations obviously will display no differences. The Restore button allows the original data to be recovered before adjustment, allowing one to modify the calculation method or the observations without the risk of committing errors.
Once the traverse has been compensated in the Close frame, the closure errors calculated are shown. These are:
eD: Distance error
eH: Horizontal error with regard to the length of the traverse
eV: Vertical error with regard to the length of the traverse
eX: Error in X
eY: Error in Y
eZ: Error in Z
eA: Angular error
In the dialogue it can be observed that if we compensate by least squares, directly under the coordinates a message appears about the Chi-Square test, informing us whether this test has been passed or not. With this in mind, the corresponding option under Configuration > Topography > Least Squares must have been enabled.
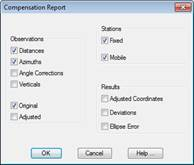
The Print button displays a dialog box allowing one to select the different elements to be included in the report that is generated:
To obtain the observation data, one can select among Distance, Azimuths, Angular or Vertical, and choose Original, Adjusted or both. One can choose to include information about Fixed Stations or Mobile Stations, as well as the results for Adjusted Coordinates, Deviations or Error Ellipses. The latter two are used for least squares calculations.
Compensation Report
Method of Calculation: Least Squares Adjustment
Calculation in Plane Coordinates
Corrections Used
- Sphericity and Refraction
Fixed Stations
Name X Coord. Y Coord. Z Coord. Scale Code
1 300000.000 4000000.000 100.000 1.00000000
Mobile Stations
Name X Coord. Y Coord. Z Coord. Scale Code
5 299989.318 4000035.756 100.746 1.00000000
8 299962.773 4000056.854 97.740 1.00000000
11 299896.363 4000099.579 94.348 1.00000000
12 299909.630 4000124.664 96.158 1.00000000
13 299927.334 4000158.673 97.743 1.00000000
6 300011.798 4000095.504 102.279 1.00000000
Closing Errors
L: 418.694
eD: 0.045 *
eX: 0.008
eY: -0.045
eZ: 0.021 *
eH: 1/9229 *
eV: 1/20247
eA: -0.1600
Distance Observations Original
Origin St. Observed St. Observed Std. Dev. Calculated Remainder D Reliability
1 5 37.337 0.0030 37.320 0.017 * Good
5 1 37.344 0.0030 37.320 0.024 * Good
5 8 33.875 0.0030 33.898 -0.023 * Good
8 5 33.886 0.0030 33.898 -0.012 * Good
8 11 78.941 0.0030 78.955 -0.014 * Good
11 8 78.922 0.0030 78.955 -0.033 * Good
11 12 28.452 0.0030 28.392 0.060 * Good
12 11 28.446 0.0030 28.392 0.054 * Good
12 13 38.412 0.0030 38.358 0.054 * Good
13 12 38.415 0.0030 38.358 0.057 * Good
13 6 105.493 0.0030 105.482 0.011 * Good
6 13 105.511 0.0030 105.482 0.029 * Good
1 6 96.176 0.0030 96.220 -0.044 * Good
6 1 96.178 0.0030 96.220 -0.042 * Good
Azimuth Observations Original
Origin St. Observed St. Observed Horz.Corr. Std. Dev. Calculated Remainder D Reliability
1 5 381.5460 0.0000 10.3786 381.5178 0.0282 * Good
5 1 0.0000 181.5357 10.3775 181.5178 0.0179 * Good
5 8 161.2200 181.5357 10.9597 342.7348 0.0209 * Good
8 5 0.0000 142.7829 10.9576 142.7348 0.0481 * Good
8 11 193.6440 142.7829 7.9316 336.3689 0.0580 * Good
11 8 0.0000 136.3744 7.9320 136.3689 0.0055 * Good
11 12 294.5760 136.3744 12.2225 30.9508 -0.0004 Good
12 11 0.0000 230.9731 12.2242 230.9508 0.0223 * Good
12 13 199.5660 230.9731 10.2240 30.5396 -0.0005 Good
13 12 0.0000 230.5287 10.2236 230.5396 -0.0109 * Good
13 6 310.2860 230.5287 7.5650 140.8766 -0.0619 * Good
6 13 133.1140 207.7878 7.3040 340.8766 0.0252 * Good
1 6 7.8840 0.0000 7.6615 7.8269 0.0571 * Good
6 1 0.0000 207.7878 7.6615 207.8269 -0.0391 * Good
Planimetric Adjustment
Number of Equations: 35
Number of Unknown Quantities: 12
Number of Iterations: 2
Square Chi Test
Chi2: 5.5027e-004
Confidence Level: 95 % Passed
Deviations
Station Sx Sy
5 0.0757 0.0121
8 0.0885 0.0384
11 0.0828 0.0497
12 0.0900 0.0658
13 0.0867 0.0610
6 0.0742 0.0248
Altimetric Adjustment
Number of Equations: 14
Number of Unknown Quantities: 6
Number of Iterations: 1
Deviations
Station Sz
5 0.0097
8 0.0126
11 0.0138
12 0.0138
13 0.0126
6 0.0097
Consult the sections below for a more detailed explanations about the calculation methods. The ideal method will depend upon the particular job in question and on the observations’ accuracy. In any event, the users’ professional experience should be relied upon.