This calculation method can be applied when the result was obtained by the intersection of observations from other instrument set-ups and the reference station, using at least two horizontal observation readings. This utility is accessed through the Surveying > Utilities > Direct Intersection command. The program requests the station to be processed. Additionally, this option can also be accessed by clicking the Direct Intersection button in the Station Calculation screen displayed in Advanced mode. It is understood that the station currently on screen is being calculated.
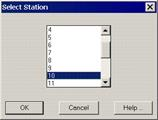
The program then requests the station to be calculated and displays a window showing information on all the observations from the station to be calculated, along with a schematic representation of each one.
One can select the calculation method by choosing between Angles Only, Distances Only and Angles and Distances. 2D or 3D calculations can also be specified by clicking the appropriate buttons.
The program displays a simplified representation of the calculation in the top left-hand window, consisting of a circle indicating the solution found, lines coming out of it drawing the angle observations should they be enabled (Only Angles or Angles and Distances modes), and some circles that express the distance observations should they be enabled (only Distance or Angles and Distances modes). The colour of each of these observations corresponds to its position on the observation list with the AutoCAD colour number system: red of the first, yellow for the second, etc. Should there be more than seven observations, colour assignment starts again from the beginning.
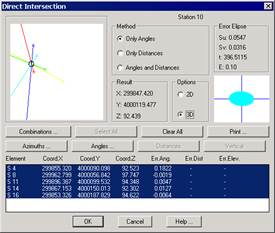
It is possible to activate or deactivate an observation for calculation purposes, by selecting one from the on-screen list. The observation’s representation changes to broken lines. The Select All button allows one to choose all the elements observed, even when they may be beyond the admissible error tolerance range. The Clear All command deselects all the observations considered.
The Azimuths, Distances, Angles and Vertical buttons display on-screen on lists corresponding to the azimuth, distance, angle and vertical equations used in the calculation that were obtained from observations between stations. This information may be edited or printed. Consult the Basic Concepts and Traverse Adjustment sections for further details.
If the Goodness-of-fit tests have been enabled under the Least Squares option within the topography configuration, the Results frame will be shown if the Chi-Square test has been passed or not. Furthermore, in the lists of distance, azimuth, angular and vertical observations, a column is added with the reliability level resulting from the Baarda test. In this case the values may be: perfect, good, poor, bad or incorrect.
The calculation process consists of the gathering provisional coordinates by means of an initial approximation and subsequently adjusting them using the least squares method.