On executing this command MDT will show the information associated with an MDT grid:
Coordinates: The minimum and maximum coordinates of the grid and the size of the same in meters.
Areas: Shows us the Topographic Surface (2D) and the Natural Surface (3D).
In Topography natural surface means the curve surface the shape of which coincides with the physical reality we intend to represent. However, the very nature of the graphic representation systems, as occurs in the bounded plane system, among others, obliges us to use its orthogonal projection on a horizontal reference plane as the most common surface, assigning it the name topographic, agrarian or reduced surface. The topographic surface is always smaller or equal to the natural surface as the former is flat and the latter may be curved. Moreover, we need to consider that two real different surfaces may correspond to the same horizontal surface. It is normally the topographic surface we are interested in – that represented in plans and maps -, although circumstances may exist where the natural surface is the target measurand, such as, for example, in cases of surface treatment. See the Surfaces chapter.
Furthermore, information is also shown on the size of the cell, number of cells, columns and rows.
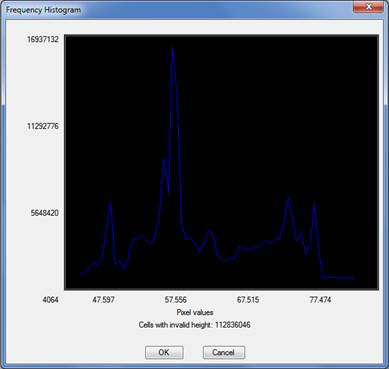
Clicking on the Histogram tab will show the distribution of the grid values. The X axis on the graph shows values of the heights, while the Y axis shows the absolute frequency (number of pixels with this height value). Hence, the distribution of heights in the grid is shown in an intuitive manner. The number of cells with no defined height is also shown.