3.2. Import Break Lines |
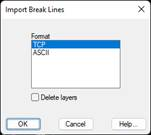
This utility allows one to draw the break lines defined in files having different formats. The following window allows one to select the file format types from different programs.
Files with a .ROT extension are DTM break line files. These files are easy to edit text files having the following structure.
The first line must contain a valid layer name, a color and an optional type of line, each separated by a space. This data will be used to create a layer on which to draw the break lines specified from now on, until a line of this type is found.
There are two ways of defining break lines. When one wishes to join a series of consecutive points, the first and last numbers and the numbering interval separated by one or several spaces simply have to be entered. For instance, when line “35 41 1” is read, the program will draw a line joining the points 35,36,37,38,39,40 and 41 in increasing order. The final point should be greater than the initial point, or otherwise the program will abort and show the following message “ERROR: Point invalid point interval on line X". It is not necessary to define all the points within the interval, but at least two of them have to be specified.
The other possibility consists of specifying a sequence that does not follow an arithmetical progression or respect the order of point numbers. Point numbers separated by commas must simply be written. All these points have to be defined on the scatter plot. Otherwise, the program issues a warning by displaying the following message: "ERROR: Point X does not exist on line Y".
The polylines end with a line that is either blank or has “C” as its first character, in which case it will close with the first point.
Example: DEMO.ROT file
BROOK 5 BROKEN
45
19 12 -1
STATION 7 DASHDOT
48
11 1 -1
43
68 72 1
51
BOUNDARY 4
42 45 1
73 79 1
12,46
48 51 1
41
C
This file would be interpreted as follows:
Creation of a layer called BROOK with color 5 (blue) and BROKEN line type; and line 45-19-18-17-16-15-14-13-12 will be drawn inside it.
Creation of the STATION layer with color 7 (white) and DASHDOT line type, in which the 48-11-10-9-8-7-6-5-4-3-2-1-43 and 68-69-70-71-72-51 lines are traced.
Creation of the BOUNDARY layer with color 4 (cyan), drawing line 42-43-44-45-73-74-75-76-77-78-79-12-46-48-49-50-51-41 and closure with point 42.
|
|